

Degenerative neurological diseases, such as Parkinson’s and Alzheimer’s disease or schizophrenia have devastating impacts on sufferers and their loved ones.
|
|
| 3D Illustration of active neurons in the brain |
ANSTO researchers have conducted research into an improved data analysis method for estimating changes in physiological parameters over time.
This work has made it possible for certain parameters to be applied to a broader range of experimental conditions and disease states than previously possible, and is enabling researchers to better understand the extent to which changes in these parameters are due to a disease’s progression or are a response to treatments.
Positron Emission Tomography (PET) is a key medical imaging technique used to obtain dynamic images of functional processes in the body and monitor receptors in the central nervous systems associated with cognition, memory, learning, motivation, motor control and pleasure. Abnormal function of these receptors is a factor in degenerative neurological and neuropsychiatric diseases.
Physiological parameters related to the receptors can be estimated from the PET and can be monitored over time. Being able to pick up small changes in these parameters, can lead to a better understanding of these diseases, their triggers and treatments.
|
Catriona Wimberley1, Anthonin Reilhac2, Frederic Boisson2, Kristina Fischer3, Marie-Claude Gregoire2
1Brain and Mind Research Institute, University of Sydney, 2ANSTO,
3Department of Preclinical Imaging and Radiopharmacy, Eberhard Karls University of Tübingen, Germany
|
Set up of the study
By injecting a radiotracer into an organ we can monitor how that tracer advances in an organ of interest over a certain time period, called a spatiotemporal distribution.
Traditionally, a dynamic series is acquired after radiotracer injection, and the information about the distribution of the radiotracer is collected using Positron Emission Tomography (PET).
In parallel, the radiotracer concentration delivered to the organ is measured, generally via blood sampling, and an input function to the system is derived.
The dopamine D2 receptor system is involved in many neurodegenerative and neuropsychiatric disorders such as Parkinson’s Disease, Alzheimers and Schizophrenia.
[11C]raclopride is a PET radioligand that is used extensively to study dopamine D2 receptor availability in the striatum (a region in the brain rich in these receptors) in normal conditions as well as for studying pathologies, changes in response to treatment or pharmacological intervention.
The parameters that describe the receptor system are the receptor density (B’max), which describes the number of receptors in the area of the brain and receptor system being studied and the apparent affinity (1/appKd) which describes the affinity that the particular ligand has for the receptor.
By monitoring these parameters (receptor density, B’max, and affinity, 1/appKd) over time we obtain a longitudinal study of neurodegenerative diseases, from PET data.
|
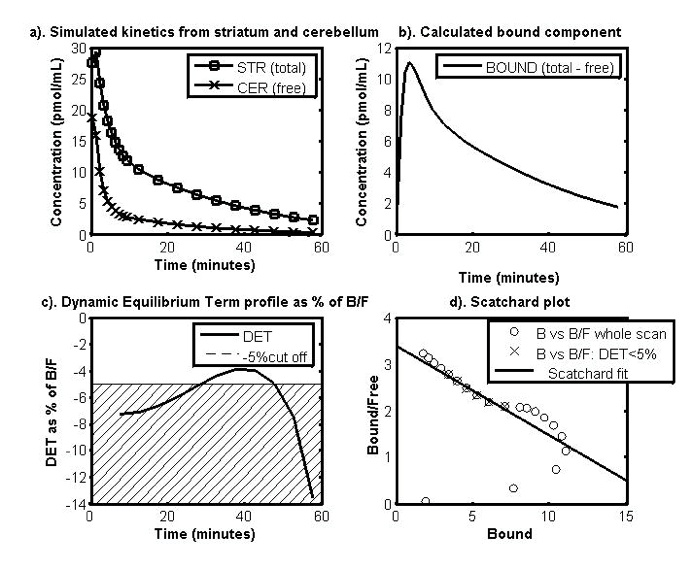
| Figure 1: Data-driven method for choosing the optimal time window. Determination of the portion of the curve to use as guide by the residual term: a) Simulated time activity curves (TACs) of the target brain region, the striatum (total) and the reference region, the cerebellum (free), b) the TACs for the bound component, c) the dynamic equilibrium term (DET) profile from time t* as % of the ratio of B/F and cross hatching to indicate the cut-off point at 5 % and d) the Scatchard plot using the B and F from the TACs. The crosses show where the section taken when using the data driven method based on the DET profile. |
To calculate the parameters of the receptor system
Several methods have been derived to estimate biological parameters such as metabolism/incorporation rate or receptor density/affinity from the PET data. Most of them rely on the concept of compartmental analysis [1] which requires an arterial blood sample.
Multiple injection protocols coupled with non-linear compartmental analysis, in the rodent have been used [2,3] to fully identify all the model parameters and thus biological values, such as receptor density, B’max, and apparent affinity, appKd, for the radioligand. These complex procedures cannot be used in longitudinal studies because they require blood sampling for an arterially sampled input function and long-time anaesthesia (up to three hours).
There are simplified methods that have been developed, such as the Simple Reference Tissue Model. These methods are used because they simplify the experimental protocol and do not require arterial blood sampling.
However, these methods are used to determine the binding potential, or BP [4], which is defined as the ratio of receptor density, B’max, and affinity, appKd.
A change in BP can therefore result from a change in B’max and/or appKd and this can lead to misinterpretation, especially when both individual parameters vary.
A simple, single injection protocol that could produce stable and robust estimates of both B’max and appKd for a range of experimental conditions and disease states would be most ideal for use in longitudinal euroreceptor studies.
Determining the parameters for the D2 dopamine receptor system using the partial saturation approach
The partial saturation approach (PSA) was originally proposed by Delforge et al. [5,6] to estimate B’max and appKd independently in a single-injection/single-scan experiment without blood sampling.
The method is based on setting up an ’in-vivo equilibrium state‘ after a single injection of ligand to partially saturate the target receptors.
The method exploits the natural decrease in bound ligand concentration to give a range of values for free ligand in the brain (F) and ligand bound to receptors (B) needed for a Scatchard analysis.
Scatchard analysis is a graphical method used to determine B’max and appKd, usually used for in vitro binding experiments, but adapted for in vivo methods.
It requires a dose of the ligand that is sufficiently large to occupy a significant percentage of receptor sites, but not so large so that a significant decrease can be observed during the limited time of the scan (1 hour at most).
The aim of this work was to increase the range and applicability of the Partial Saturation Approach (PSA) by developing a data-driven strategy for determining B’max and appKd, and validating the strategy using a simulation model based on experimental mouse PSA data by Fischer et al[7] with the ultimate goal of generalising the method for use with [11C]raclopride PET experiments in the mouse brain.
|
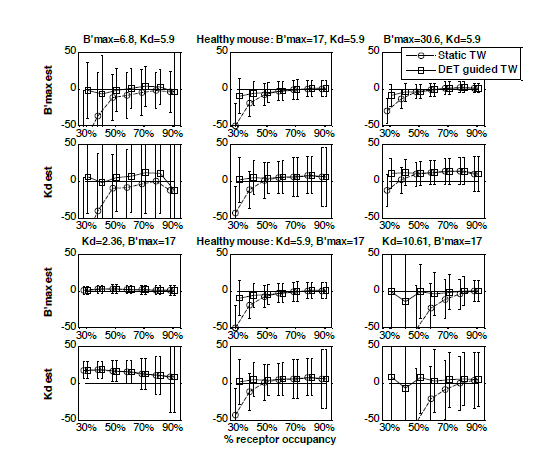
| Figure 2: Percent relative error of parameter estimates (receptor density B’max, and apparent affinity appKd) for the two time windows, a static time window (circles) as has been used in the past and the data driven time window (squares) which uses the dynamic equilibrium term, or DET- with equivalent noise added for a range of receptor occupancy (injected dose) levels and a range of simulation parameters: B’max simulated at three different levels, i.e. a) 6.8, b) 17 and c) 30 and appKd simualted at d) 2.36, e) 5.9 and f) 10.6. Note that the lowest occupancy points for the static time window curves in the plots a) and f) are out of range. The values of the error in these cases are: B’max = 6.8, error = 75% and appKd = 10.61, error = 380% respectively. |
Validating the method
To be able to apply the PSA confidently, the following assumptions needed to be validated for a range of receptor occupancy levels and over a range of experimental conditions. Firstly, the method requires the use of an independent measurement of the free ligand concentration, which is estimated using a reference region, the cerebellum (CER).
Secondly, an apparent equilibrium state needs to be achieved, and a time window of data chosen to reflect that. And thirdly, the occupancy of the receptors in the target region, the striatum (STR) must be sufficient to allow a good range of Bound and Free values, needed for the analysis, over the time of the PET scan.
The data driven method for analysing the PSA data is shown in Fig. 1. It involves isolating where in the kinetic curves from the PET scan a dynamic equilibrium is reached by using the dynamic equilibrium term (DET) as an indicator. The DET shows the rate of change of the B over time as a proportion of the B/F value, i.e. the ratio of the ligand bound to receptors (B) and the free ligand in the brain (F).
Ideally, to be in equilibrium, the rate of change of B and therefore the DET would be zero, however, as it is a dynamic system, in vivo, the DET will never be zero. Instead, the data used in the estimation of B’max and appKd is taken from the point at which the DET component is <5% of B/F.
A range of simulated PET experiments was generated to test and validate the method described above for a wide range of experimental conditions, such as receptor occupancy levels (by varying the injected dose of ligand) and disease states (by varying the B’max and appKd levels) as well as adding realistic PET noise to the simulations to gauge the effect of noise on the accuracy and robustness of the estimates.
The simulations were based on PET experimental data from Fischer et al [7] . The analysis method as above was applied to the simulated PET data and the parameter estimates compared against just using a static time window of 10-50 minutes, the common method for analysing the PSA data.
The plots in Fig. 2 show that for most of the experimental conditions simulated the estimates using the DETguided time window gives much more accurate estimates, especially at low levels of receptor occupancy.
Using the DET-guided time window the estimates are not correlated with the occupancy level, as is the case with the static time window, especially for occupancy levels lower than 50%. That means that in PET experiments variability in the occupancy levels will not translate into variability in parameter estimates.
Using the method under other conditions
This study extended and validated the PSA method with the DET guided time window as an appropriate tool for estimating B’max and appKd with [11C]raclopride in the rodent. It is now possible to use the PSA for a broader range of experimental conditions than previously done.
These conditions include pharmaceutical or disease induced changes of B’max and appKd, and a range of receptor occupancy levels. Being able to explore the availability of dopamine receptors in the striatum using [11C]raclopride with a simple and straightforward method will help to assess changes due to disease state or pharmacological intervention in longitudinal studies.
References
- Watabe, H., Ikoma, Y., Kimura, Y., Naganawa, M. & Shidahara, M. PET kinetic analysis--compartmental model. Ann Nucl Med 20, 583-8 (2006).
- Mauger, G. et al. Multiinjection approach for D2 receptor binding quantification in living rats using [lsqb]11C[rsqb] raclopride and the [beta]-microprobe: crossvalidation with in vitro binding data.
- J Cereb Blood Flow Metab 25, 1517-1527 (2005).
- Gregoire, M.-C. BrainPet, 2007 PO5- 3U(2007).
- Lammertsma, A.A. & Hume, S.P. Simplified Reference Tissue Model for PET Receptor Studies. NeuroImage 4, 153-158 (1996).
- Delforge, J. et al. Quantification of benzodiazepine receptors in human brain using PET, [11C]flumazenil, and a single-experiment protocol. J Cereb Blood Flow Metab 15, 284-300 (1995).
- Delforge, J. et al. Quantitation of benzodiazepine receptors in human brain using the partial saturation method. J Nucl Med 37, 5-11 (1996).
- Fischer, K. et al. Noninvasive nuclear imaging enables the in vivo quantification of striatal dopamine receptor expression and raclopride affinity in mice. Journal of nuclear medicine : official publication, Society of Nuclear Medicine 52, 1133-41 (2011).