
Post Doctoral Research Fellow

Showing 1881 - 1900 of 1901 results
ABC has reported space research on plants being sent to the moon at the Centre for Accelerator Science.
Earlier this month, ANSTO welcomed a delegation of Elders from the Willandra Lakes Region World Heritage site to its Lucas Heights campus. The visit marked a significant collaboration between Traditional Custodians and scientists working to uncover the environmental history of Lake Mungo.
A team of scientists from The Australian National University (ANU) has discovered how a powerful “weapon” used by many fungal pathogens enables them to cause disease in major food crops such as rice and corn
Southern Cross researcher Dr Alana Gall, who recently became an ANSTO research Fellow, has been awarded more than $640,000 to lead a research program focused on First Peoples' Cultural Medicines (also called bush medicine) in Australian healthcare.
The panel will investigate a wide range of potential effects spanning radiological, environmental, climatic, agricultural, public health, and socio-economic impacts, through a scientifically rigorous and independent lens.
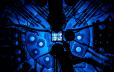
The Free ANSTO XR app uses a mix of AR and VR to transport you to the scale of an atom and discover the world of protons, neutrons, and electrons.
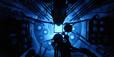
See how synchrotron light generated from super accelerated electrons can give scientists x-ray vision.
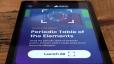
See how the ANSTO periodic table poster works with Augmented Reality.
ANSTO presented and participated in a panel discussion at the annual Natural Products Futures Forum in Ballina.
To contact ANSTO, let us help find what you need or you can submit an enquiry.
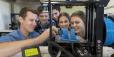
Visit world-class science facilities and learn about the important role of scientists in society and the different environments they work in.
Students participate in a fun and engaging "Colour and Light Show" and discuss their science interests with our experienced education team.
All tours are available Monday to Friday for Year 3 to 6 classes. The cost per student is $9 and teachers are free.
This tour is an introduction to isotopes, radioactivity and half-life, and the real-life applications of these concepts. Students will do a series of hands-on activities using the workbook below.
We are working on new content to address the new 2026 NSW Science Stage 5 (Year 9-10) syllabus.
All tours are available Monday to Friday for Years 7 to 12 classes. The cost per student is $12.50 and teachers are free.
Please print enough copies of the relevant workbook for your class before your visit to ANSTO.
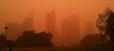
This resource provides a systematic, step by step scaffold of a scientific investigation using secondary data of atmospheric measurements made on the grounds of Liverpool Girls' High School from March 2019 to February 2020.
Students will:
- propose an hypothesis after researching relevant background information
- process and analyse data and information
- create a graph and interpret results
- communicate the process and findings of their investigation in the form of a scientific report
- increase their understanding of the atmosphere and the factors that influence it
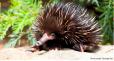
This resource guides students through how to interpret and analyse authentic research data, generated during a collaborative project between UNSW, UTS, ANSTO and Taronga Zoo Sydney. The project examines the use of high-resolution x-ray fluorescence as a tool to combat the international illegal wildlife trade (IWT) of short beaked echidnas, which are being removed from the wild and claimed as captive-bred.
Students will:
- examine the adaptations of short beaked echidnas that increase their ability to survive in their environment
- explore the use of technology in contributing to the study and conservation of biodiversity
- construct simple graphs of the provided data using MS Excel, and interpret and analyse these graphs
- investigate how scientific knowledge interacts with social, economic, cultural and ethical issues.