In the thirty years that Prof David Cohen has been monitoring air quality by measuring fine particle pollution under the Aerosol Sampling program at ANSTO, there have been several surprises. The recent catastrophic bushfire that hit Australia last summer produced another somewhat unexpected result.
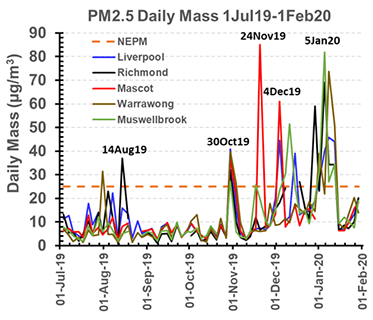
When Cohen plotted the results from a number of sampling sites across New South Wales over the bushfire period and earlier, he saw the 24-hour average level of fine particle pollution were well above the national health goal of 25 micrograms per cubic metre (µg/m3) (red dotted line below) and record daily maximum levels for all sites.
Daily average levels of fine particle pollution at six sites in NSW. Bushfies occurred from November 2019 through January 2020. Red dotted line is the national health goal.
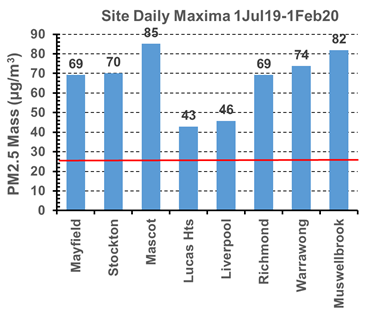
The maximum daily levels of fine particles pollution at respective sampling sites. Dates not plotted.
The standard (PM2.5) refers to fine particulate matter 2.5 micrograms in size, which is far too small to be seen with the human eye.
“The Australian health goal is set for a 24-hour period, which is why we use this time interval for our sampling. Generally, the daily levels at the NSW sites in Liverpool, Richmond, Mascot, Stockton Warrawong and Muswellbrook, stay below 10, except in winter when people burn wood for domestic heating. The levels during the bushfires from October through January were many times greater than normal.”
Stressing that the data reflects a 24-hour period and not hourly levels of fine particle pollution as reported by some media outlets, Cohen said that Mascot reached 85 and Muswellbrook 82, which were eight to ten times the usual daily levels for these sites.
In contrast, the high at Lucas Heights, which sits on an escarpment and not in the Sydney basin, was 43 µg/m3.
The sites he plotted recorded levels of fine particle pollution way above the health goals, which can be considered hazardous if inhaled deep into the lungs.
The sampling sites are dispersed geographically in key regions, including metropolitan, North Coast, South Coast, Hunter Valley and Wollongong. The Sydney basin and adjoining areas were literally surrounded by fire zones, and the smoke was carried by winds from all directions at different times and often into the Sydney basin itself.
“You see some sites hitting a peak on different dates, which was dependent on wind direction, and some sites with overlapping peaks,” said Cohen.
And the smoke source of fine particle wasn’t the only surprise. Soil as a pollutant is also monitored.
“Our data shows that significant amounts of soil were being transported by winds from the fire zones into regions well beyond the fire zones themselves,” said Cohen.
The intense heat from the fire lifts up soil and strong winds transport it over large distances.
“There were large increases in the levels of soil, particularly in Muswellbrook, which had two high PM2.5 mass events on 4 December and 5 January that could be classified as dust storms.”
The accelerator techniques used to measure elements in the pollutants enables them to produce fingerprints that identifies the sources of the pollution such as smoke, soil and sea spray as well as industrial sources and emissions from automobiles.
The COVID-19 crisis is also having an impact on our science and our ability to continue the ANSTO ASP sampling program.
Unfortunately, the ASP program has been stopped temporarily.
“We can’t send out the filters which are used to collect particles or change the filters and there is nobody at the sampling sites to send them back to ANSTO,” said Cohen.
“Without accelerators running, we can’t analyse the data, which has been collected without interruption for more than twenty years.”
“We maintain a very valuable data repository of information with over 60,000 filters collected to date, which we look forward to resuming when this is pandemic is over.”