
 |
This is a highlight from ANSTO's Research Selections. Read more highlights from the Research Selections eBook.
Fine particles in our atmosphere can travel hundreds of kilometres every day. Their monitoring is crucial as they have significant impact on both human health and the environment. Over the last decade, nuclear techniques for studying fine particles in the atmosphere have improved significantly, moving from simply analysing their chemical composition to combining meteorological data, such as wind patterns and trajectory with statistical modelling, to define where the pollution actually came from.
Consequently, it is now possible to not only determine the source of pollution via a chemical composition ‘fingerprint,’ but to also quantify that source’s total contribution of fine particles in a specific location. In short, we can identify individual polluters and measure how many fine particles originated from those polluters.
Over more than a decade, David Cohen and his team have collected samples in the Richmond area of western Sydney. By using these combinatory techniques of analysing the particles’ chemical composition and taking account of meteorological data with statistical modelling, they are able to quantify the effects of air pollution.
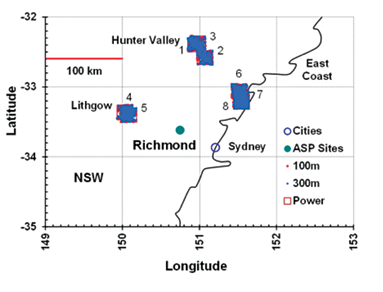
This demonstration project has found that up to half of the total sulfate air pollution in the greater Sydney region can be attributed to emissions from NSW’s eight coal-fired power stations. Despite being located many kilometres outside of the greater Sydney metropolitan area, these coal-fired power stations have a significant impact on air quality in the CBD areas of Sydney. This information is used by air quality managers to inform pollution control measures and decision making.
Introduction
As atmospheric fine particle pollution has significant impacts on our lives, there has been significant progress over the last decade to better identify its sources and hold polluters accountable. Increased computing power with new algorithms that handle big data sets has played an important role in advancing these studies.
In order to handle multiple observations in environmental monitoring mathematical models are used to analyse the different types of data sets. For the study of air pollution we investigate fine particles and analyse the data using positive matrix factorisation (PMF) and multi-linear engine (ME) methods [1,2] for determining the number and composition of sources of pollution.
Coal-fired power stations are known emitters of fine particles PM2.5 (PM2.5 stands for particles of a size of 2.5 microns or less, i.e. 0.025 mm) and pollutant gases such as SOX and NOX. ANSTO researchers have developed techniques to determine the contributions of eight coal-fired power stations, which burn over 25 MT/year (yr) of low grade sulfur coal, to the PM2.5 mass loading in the greater Sydney metropolitan area.
We have applied and compared PMF and ME techniques for identifying the source by its elemental fingerprint and quantifying the contribution of a source to total pollution levels. Using the ME methods we included data of wind observations and profiles the trajectory positions. By combining these various parameters, sources external to the Sydney metropolitan region can uniquely be tied to fine particle measurements made within this region.
|
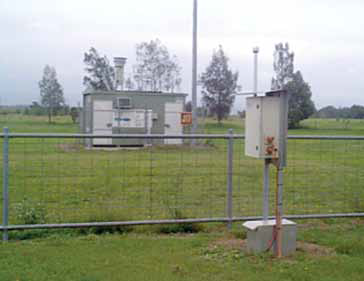
The sampling site (Fig.1b) was located at Richmond (-33.618°S, 150.748°E) in an open grassed area in the grounds of the University of Western Sydney, 53 km northwest of the Sydney CBD. Samples were taken every Sunday and Wednesday for 24 hours from midnight to midnight. The site was influenced by sources from within the Sydney CBD region and sources external to the greater metropolitan area, such as the power stations.
|
David D. Cohen, Jagoda Crawford, Eduard Stelcer, Armand J. Atanacio
ANSTO