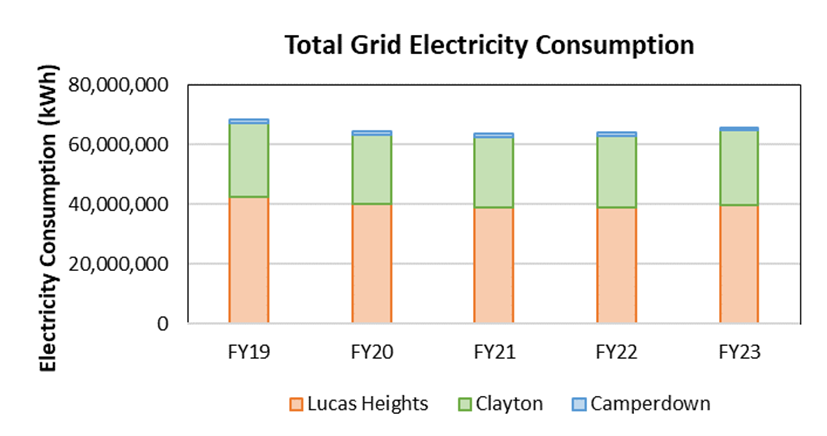

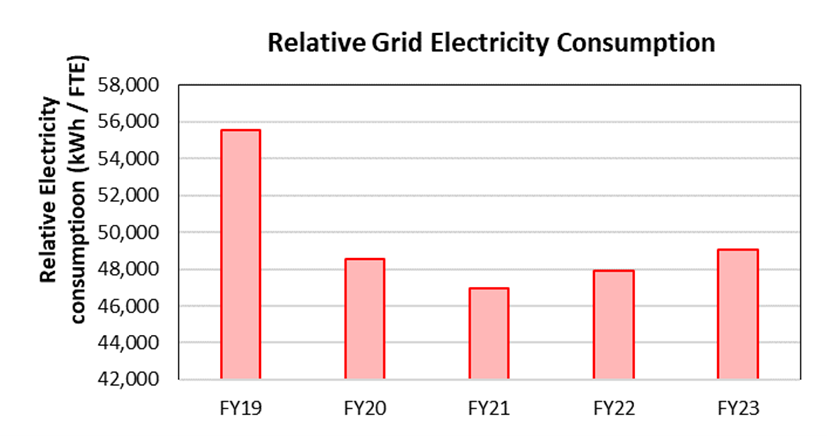
Electricity Consumption
- Operations at both the Lucas Heights and Clayton campuses have generally returned to pre-COVID levels.
- The operation of the OPAL reactor and Lucas Heights, Synchrotron beamlines at Clayton and all critical radiological safety systems across the campuses are the primary consumers of electricity. Consequently, while a substantial proportion of the work force has access to hybrid working arrangements (1-2 days working from home), this change in workforce attendance has not had a significant impact on ANSTO’s overall electricity consumption.
- ANSTO currently has about 166 kilowatt (kW) of installed renewable energy sources. In June 2023, ANSTO commenced the delivery of a new 1,500 kW solar array at its Clayton facility. This array will have the potential to produce about 1.8 gigawatt-hours of electricity annually. This will likely come online in late 2023.
- ANSTO also produced and consumed approximately 155 megawatt-hours of electricity from site diesel generators in FY2023.
- All new buildings are required to have roof-top solar installed. ANSTO is also assessing the viability of retrofitting roof-top solar across existing buildings at the Lucas Heights campus.
- ANSTO continues to install new infrastructure and replace legacy energy inefficient systems which will improve energy utilisation and reduce overall electricity consumption from the grid.
Resource usage table (FY2022 vs FY2023)
Resource Usage | Units | FY2022 | FY2023 | Change on previous year (%) |
|---|---|---|---|---|
Electricity | GWh | 64.0 | 65.7 | 2.6 |
| GWh/ FTE | 0.048 | 0.049 | 2.4 |
Installed renewable energy sources | kW | 166 | 166 | 0.0 |
Natural gas consumption (Clayton and Camperdown only) | GJ | 13,293 | 11,097 | -17 |
| GJ/FTE | 76.0 | 79.1 | 4 |
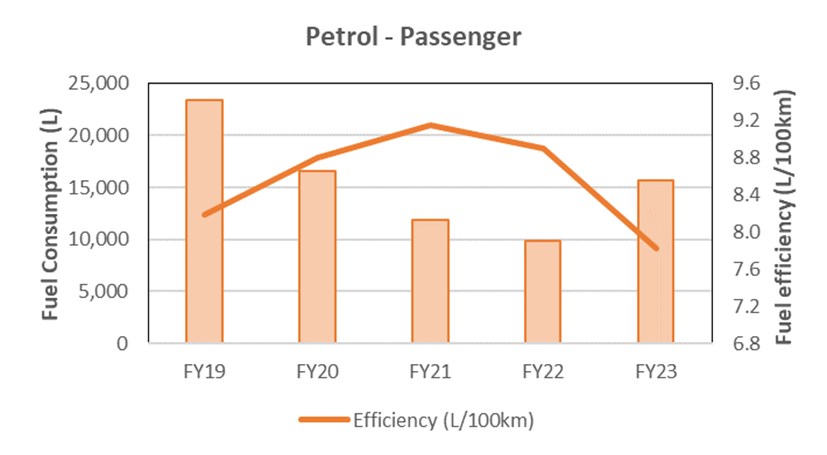
Passenger vehicle use - petrol and diesel | L/100km | 8.89 | 7.82 | -12 |
| L/FTE | 7.38 | 11.7 | 59 |
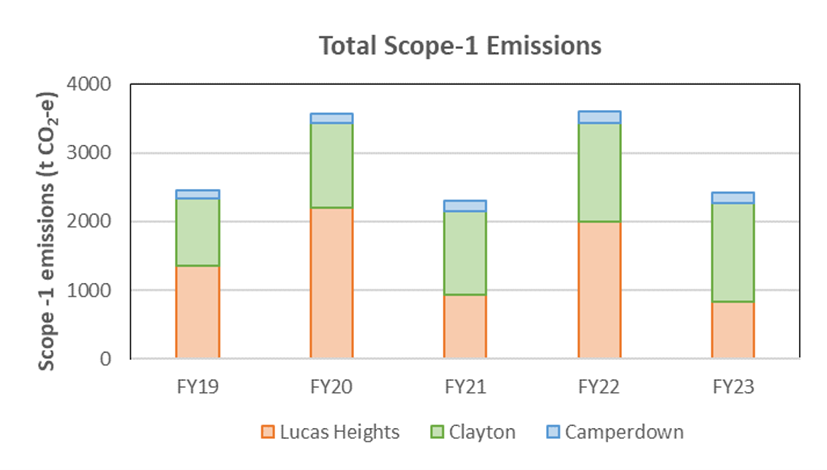
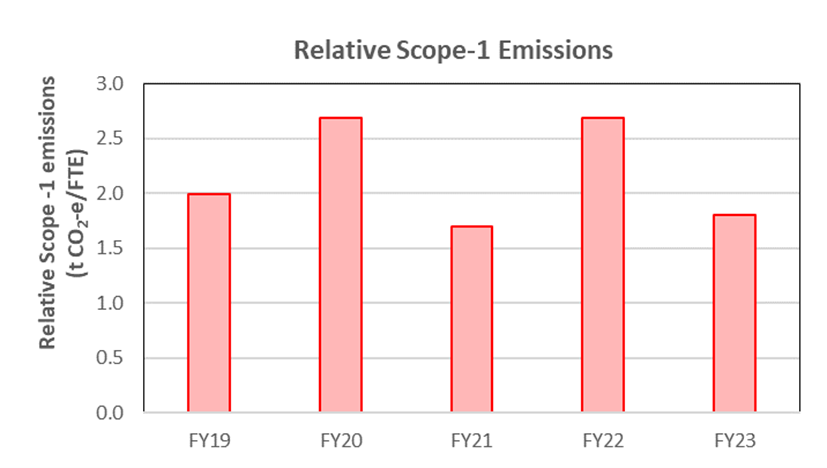
Scope-1 Emissions
Scope-1 emissions are direct emissions from the combustion of fuels and releases of fugitive gases.
- Activities that contribute to ANSTO’s scope-1 emissions include: petrol, diesel and LPG consumption by fleet vehicles; natural gas consumption for heating purposes; diesel consumption by site stand-by diesel generators; combustion of acetylene and LPG; and, small fugitive emissions of refrigerant gases contained in heating, ventilation and air conditioning (HVAC) systems and sulphur hexafluoride (SF6) from the operation of linear particle accelerators.
The lower scope-1 emissions in FY2023 compared with FY2022 is largely due to lower reported losses to the atmosphere of SF6 from ANSTO’s Centre for Accelerator Science (CAS) facility.
SF6 has a very high greenhouse warming potential, approximately 23,500 times greater than CO2. ANSTO appreciates the potential impact from the release of SF6 to the environment. To mitigate releases of SF6 to the atmosphere, ANSTO implements the highest level of leak detection and prevention within the accelerator facilities.
In FY23, ANSTO’s CAS facility recycled about 1000 kg of SF6 to a licenced SF6 recycler in Australia. This process ensures that ANSTO’s linear accelerators can function with a high level of efficiency, while minimising the amount of SF6 which could be lost to the atmosphere if it wasn’t recycled.
Emissions table (FY2022 vs FY2023)
Emissions
Units
FY2022
FY2023
Change on previous year (%)
Scope-1 emissions
(direct combustion/consumption of other energy sources other than electricity from the grid)t CO2-e
3,596
2,413
-32.9
t CO2-e /FTE
2.69
1.80
-33 Scope-2 emissions
(electricity from grid)t CO2-e
54,633
50,932
-6.8
t CO2-e /FTE
40.9
38.1
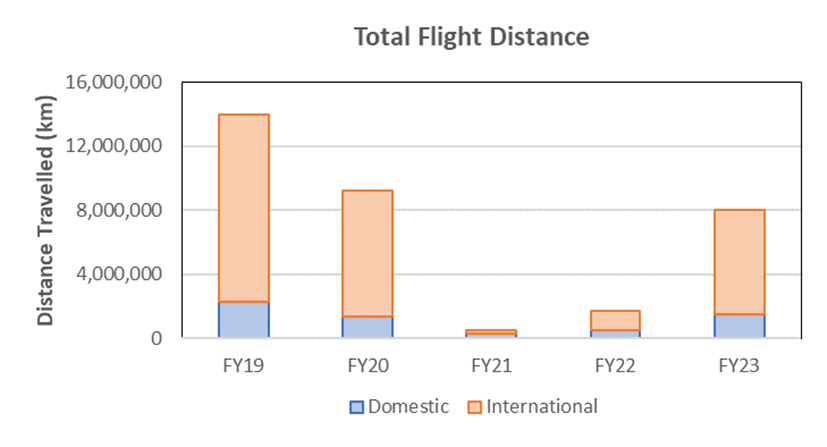
-6.9 Domestic air travel
km
492,438
1,514,547
208
km/FTE
369
1,132
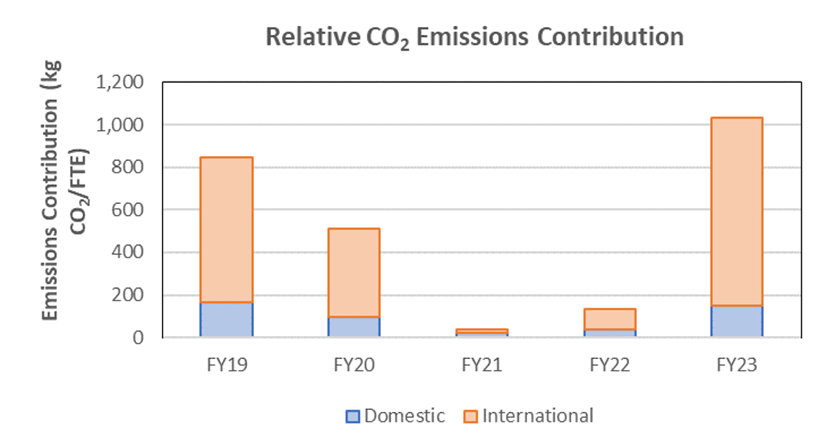
207 t CO2-e
50.9
203
299 t CO2-e/FTE
0.04
0.15
299 International air travel
km
1,237,380
6,511,566
426
km/FTE
926
4,867
425 t CO2-e
131
1,179
802 t CO2-e/FTE
0.10
0.88
800
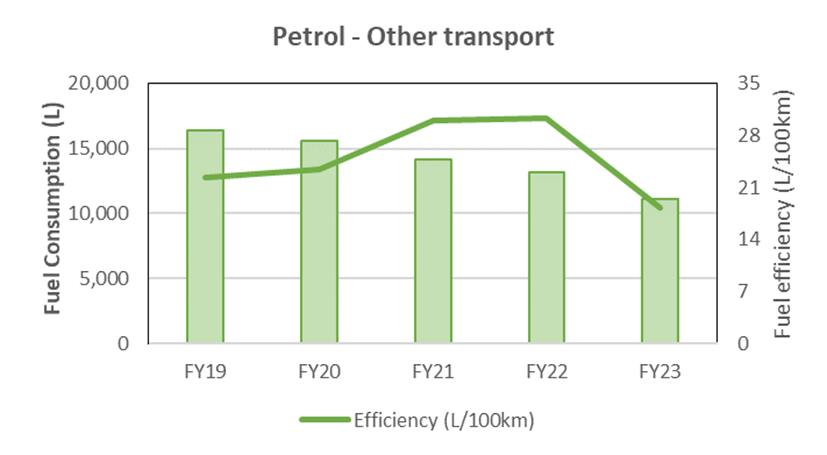
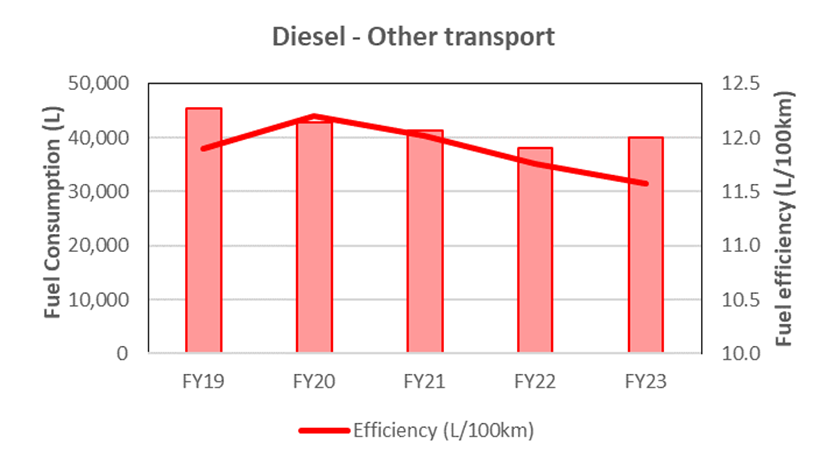
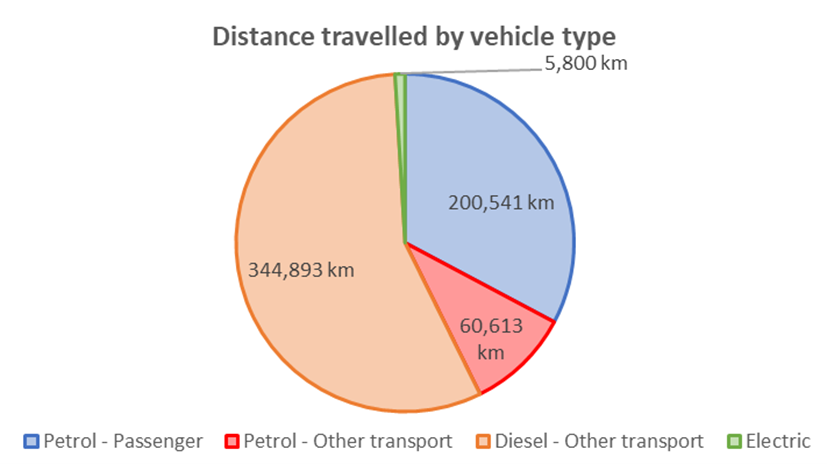
Fleet Vehicles
As operations return to pre-COVID consumption levels, so has the consumption of diesel from utility and heavy commercial fleet vehicles.
Overall, the fuel efficiency rate for both petrol and diesel fuelled vehicles has decreased, indicating better utilisation of higher efficiency vehicles over less efficient.
ANSTO has introduced three zero emission (electric) vehicles and several hybrid-petrol vehicles within its passenger vehicle fleet. ANSTO is reviewing its fleet vehicle asset management plan to align with the Australian Government’s Fleet Selection Policy for low emission passenger vehicles.
Staff flights
Domestic travel activities have generally returned to pre-COVID levels, however international travel remains about 40% lower.
Conversely, ANSTO’s staff flight emissions profile has significantly increased, due in part to the increased activity but also due to the application of standard emissions factors applied through the Australian Public Service Net Zero Emissions reporting scheme, which appear to be different to those used and reported by ANSTO’s previous travel service provider.
Legend
| kWhw Kilowattt | hour per week |
|---|---|
| FTE | Full-time equivalent staff attendance |
| kW | kilowatt |
| GWh | Gigawatt hours |
| GJ | Gigajoules (1 billion joules) |
| km | kilometre |
| L | litre |
| CO2 | carbon dioxide |
| SF6 | sulphur hexafluoride |
| tCO2 | tonne carbon dioxide |
| t CO2-e | number of metric tons of CO2 emissions with the same global warming potential as one metric ton of another greenhouse gas, |