Data Analysis
Below lists some useful programs for data reduction, search matching, analysis and structure visualisation of diffraction data.

Showing 1 - 20 of 1009 results
Below lists some useful programs for data reduction, search matching, analysis and structure visualisation of diffraction data.

Your students can analyse real research data from ANSTO scientists.
Data analysis on the X-ray fluorescence microscopy beamline at the Australian Synchrotron.
This poster shows greenhouse emissions measured in Antarctic ice cores and the Cape Grim monitoring station until 2017.
Atmosphere scientists find link between indigenous weather knowledge and Sydney air pollution.
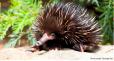
This resource guides students through how to interpret and analyse authentic research data, generated during a collaborative project between UNSW, UTS, ANSTO and Taronga Zoo Sydney. The project examines the use of high-resolution x-ray fluorescence as a tool to combat the international illegal wildlife trade (IWT) of short beaked echidnas, which are being removed from the wild and claimed as captive-bred.
Students will:
- examine the adaptations of short beaked echidnas that increase their ability to survive in their environment
- explore the use of technology in contributing to the study and conservation of biodiversity
- construct simple graphs of the provided data using MS Excel, and interpret and analyse these graphs
- investigate how scientific knowledge interacts with social, economic, cultural and ethical issues.
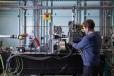
An instrument used to study any materials with structure of the length scale 1-100nm.

Launch of the second phase of construction of the underground laboratory to detect dark matter.
ANSTO to ensure ultra-low radiation environment in newly-funded Stawell Underground Physics Laboratory.