
ANSTO scientists have released a selection of their research data for use in the classroom.
Teachers can email the Discovery Centre (education@ansto.gov.au) for a copy of the answers.
The data is sourced directly from real scientific investigations. Each data set is accompanied by a worksheet that can form the basis of a series of classroom activities.
Teachers and students will need a computer with MS Excel installed to complete these activities. Google Sheets is not recommended.
View ANSTO data sets below
Investigating Ozone
Ozone in the upper atmosphere is a crucial shield of UV, but ozone at surface levels is a respiratory irritant and health hazard.
Students investigate surface-level ozone concentrations in the air around Liverpool, NSW, using descriptive statistical analysis, a univariate analysis and a bivariate analysis to explore the data. Students also investigate the relationship between ozone concentration and certain pollutant gases, as well as the effect of temperature, leading to evidence-based decisions about the future of surface-level ozone pollution in our cities.
Using elemental data to combat illegal wildlife trade
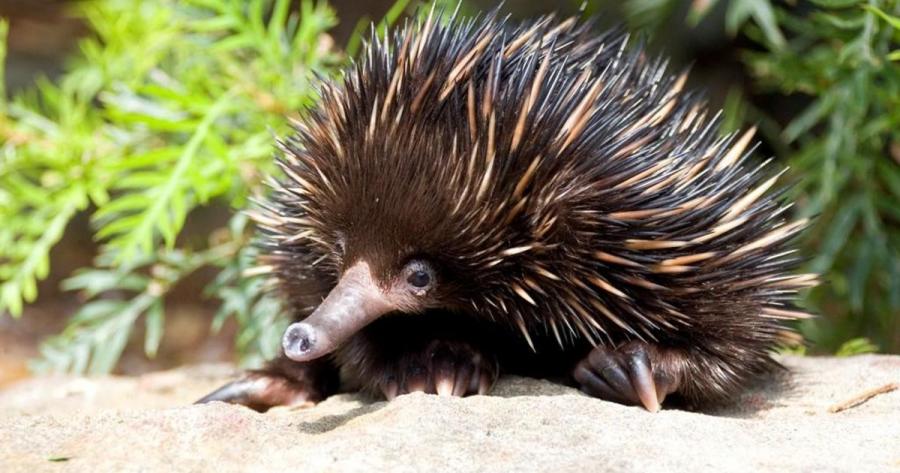
This resource guides students through how to interpret and analyse authentic research data, generated during a collaborative project between UNSW, UTS, ANSTO and Taronga Zoo Sydney. The project examines the use of high-resolution x-ray fluorescence as a tool to combat the international illegal wildlife trade (IWT) of short beaked echidnas, which are being removed from the wild and claimed as captive-bred. These activities are suitable for Senior Biology students as well as students in Years 9 and 10.
Students will:
- examine the adaptations of short beaked echidnas that increase their ability to survive in their environment
- explore the use of technology in contributing to the study and conservation of biodiversity
- construct simple graphs of the provided data using MS Excel, and interpret and analyse these graphs
- investigate how scientific knowledge interacts with social, economic, cultural and ethical issues.
Exploring what scientists do
This resource gives students an opportunity to engage in scientific inquiry through the application of working scientifically skills/inquiry skills. The document provides a systematic, step by step scaffold of a scientific investigation using secondary data of atmospheric measurements made on the grounds of Liverpool Girls' High School from March 2019 to February 2020. This resources is suitable for Years 7-10.
Students will:
- propose an hypothesis after researching relevant background information
- process and analyse data and information
- create a graph and interpret results
- communicate the process and findings of their investigation in the form of a scientific report
- increase their understanding of the atmosphere and the factors that influence it
Groundwater science
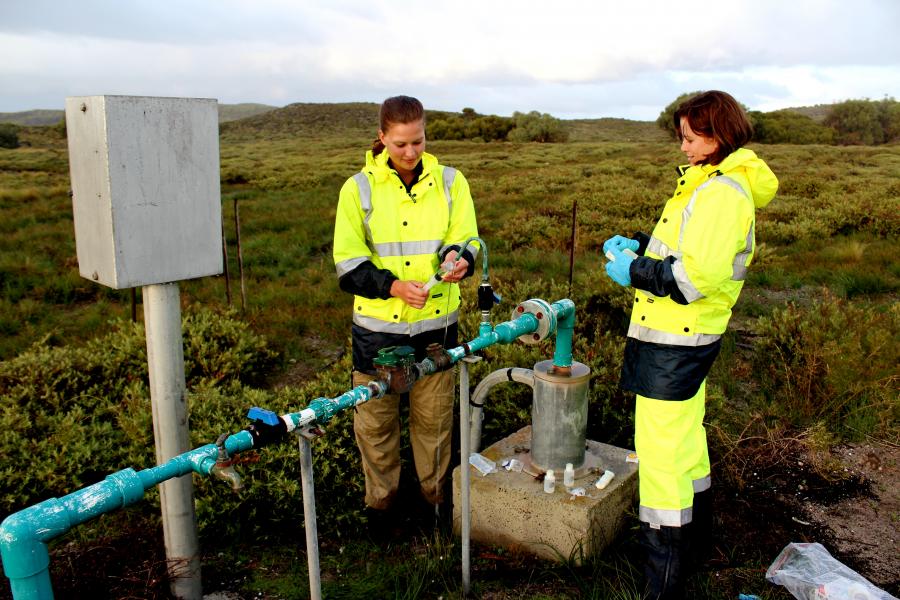
Water is a resource that needs careful management to ensure it is used sustainably. In this data set, students analyse real research data about the sustainability of groundwater on Rottnest Island. These activities are suitable for students in Years 7 to 10.
Students will:
- understand the concepts of groundwater and aquifers and the role of the water cycle
- use MS Excel to construct simple graphs (or draw graphs by hand)
- interpret and analyse graphs and other representations of data
- investigate the effects of a changing climate on groundwater resources
- distinguish between correlation and causation
Worksheet (making graphs with MS Excel)
Investigating isotopes
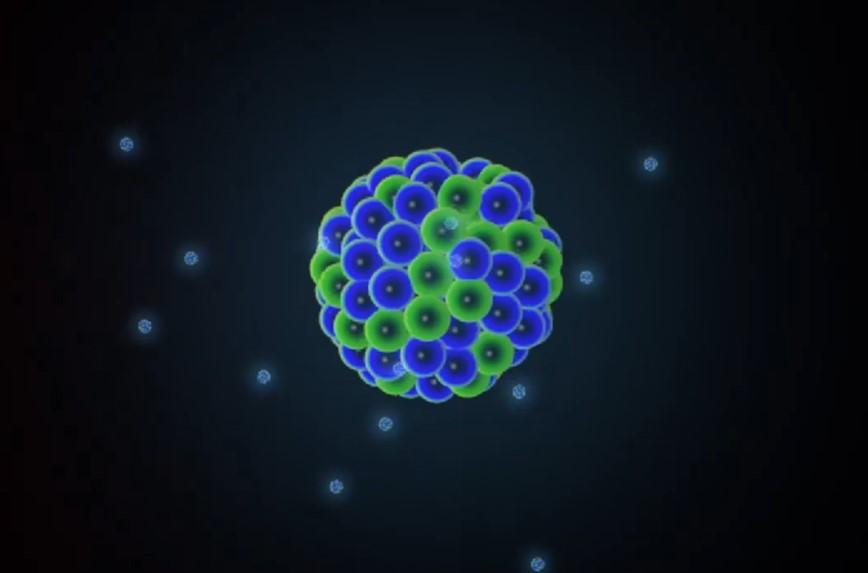
Learn about isotopes using real examples and real data, including comprehensive isotopic data of the first twenty chemical elements in the periodic table (hydrogen to calcium). Teachers can use the accompanying worksheet, in sections or in its entirety, to develop student skills in literacy, numeracy, critical and creative thinking and ICT. These activities are suitable for students in Years 9 to 12.
Students will:
- learn how the number of neutrons and protons in an isotope affects its nuclear properties
- construct a section of the Table of isotopes, using MS Excel
- investigate the properties and uses of different isotopes
Radionuclides in medicine
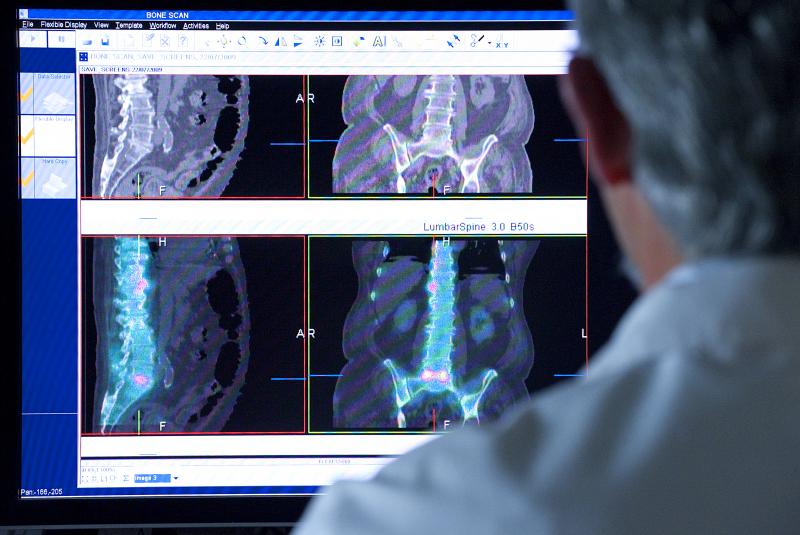
Radionuclides have been used routinely in medicine for more than 60 years. Nuclear medicine uses radiation to provide information about the functioning of a person's specific organs to diagnose or treat disease. The radionuclides used in medicine have half-lives ranging from a few minutes to several days in order to minimise the radiation dose the patient receives. For three unknown medical radionuclides, students will graph their decay over time, use the graph to calculate their half-life, and determine the identify and use of each radionuclide using background information provided.
Historic greenhouse gas concentrations from Antarctic ice core sampling
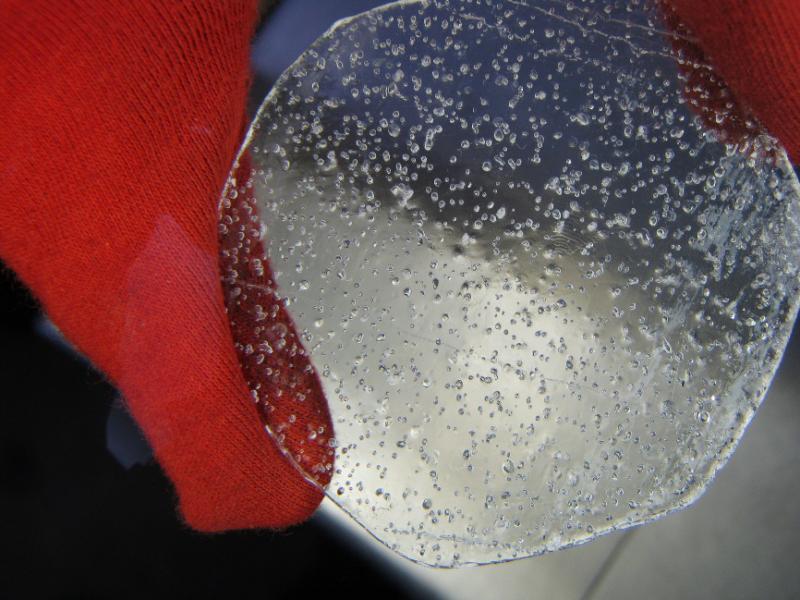
ANSTO Physicist Andrew Smith collaborates with international scientists to study historical greenhouse gas concentrations from Antarctic ice core samples. This data set contains temperature records and concentrations of carbon dioxide and methane from the last 800,000 years.
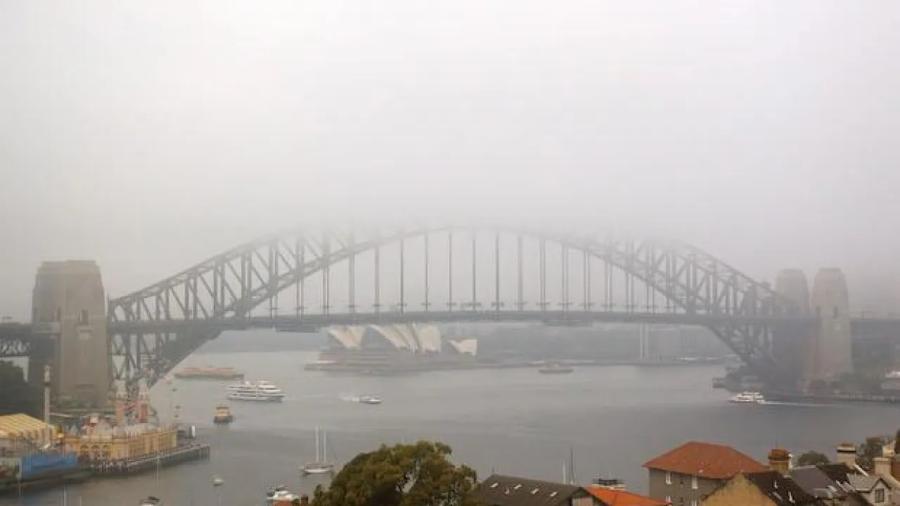
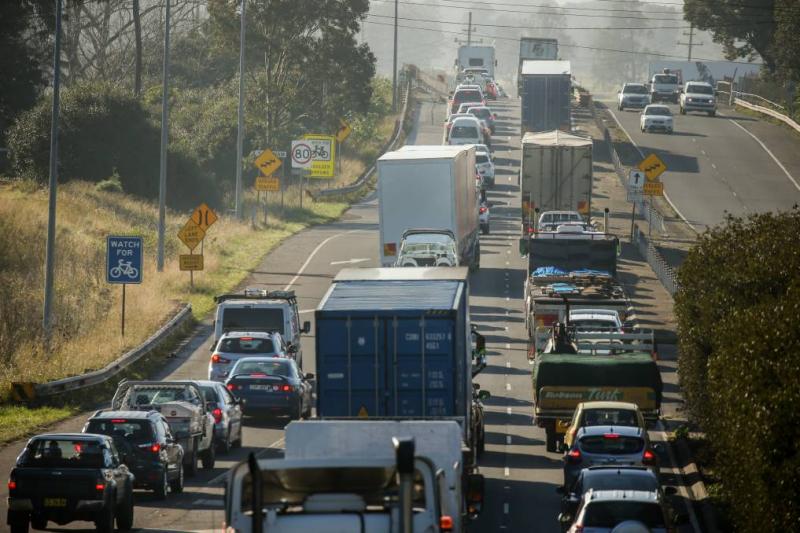
Monitoring air pollution and traffic density in Sydney
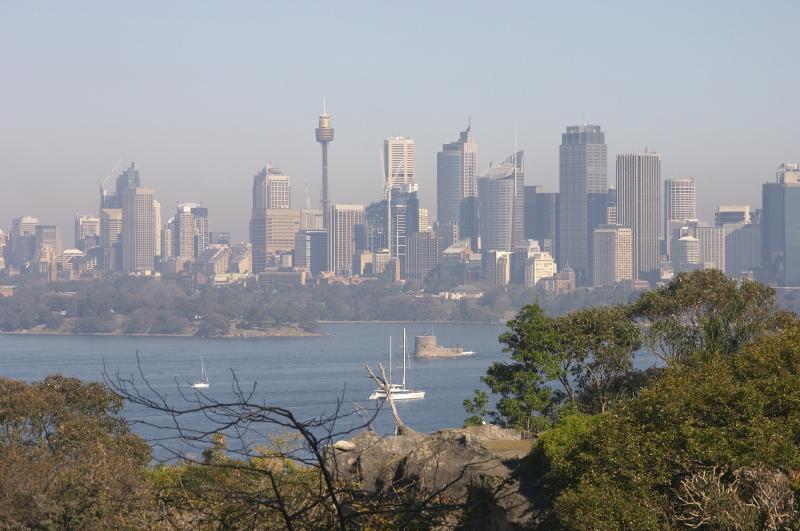
ANSTO Environmental Researcher Scott Chambers uses a naturally-occurring radioactive gas called Radon-222 to trace sources of pollution in the atmosphere. This data set contains hourly observations of meteorology, trace gas pollutants, Radon-222 concentration and traffic density collected from Western Sydney University (Richmond campus) in 2016.
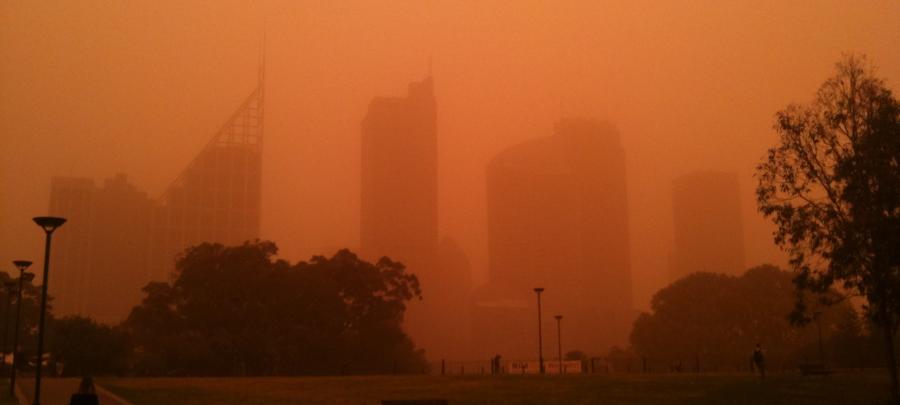
Monitoring fine particle air pollution in Newcastle
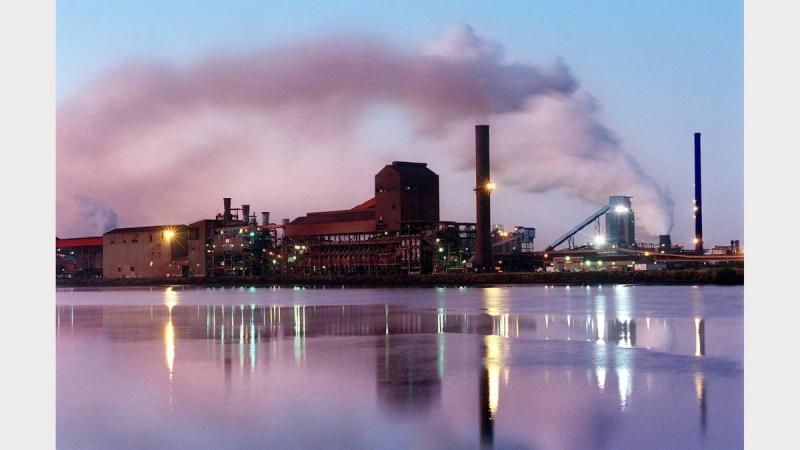
ANSTO has been measuring and characterising fine particle pollution from key sites around Australia for more than 30 years. This data set provides records from 1998 to 2019 of the concentration of 12 elements present in fine airborne particulate matter from an air sampling station located in Mayfield in Newcastle, NSW.
Praxical have worked with ANSTO to adapt parts of this resource to make a free online learning module about monitoring air pollution.
Air pollution from combustion processes in Newcastle
Combustion reactions in vehicles, household woodfires and coal-fired power plants all result in fine particle air pollution in the air we breathe. ANSTO has been measuring and characterising fine particle pollution from key sites around Australia for more than 30 years. This data set provides records from 1998 to 2019 of the concentration of 12 elements present in fine airborne particulate matter from an air sampling station located in Mayfield in Newcastle, NSW.
Praxical have worked with ANSTO to adapt parts of this resource to make a free online learning module about monitoring air pollution.
Investigating radiation in the air we breathe
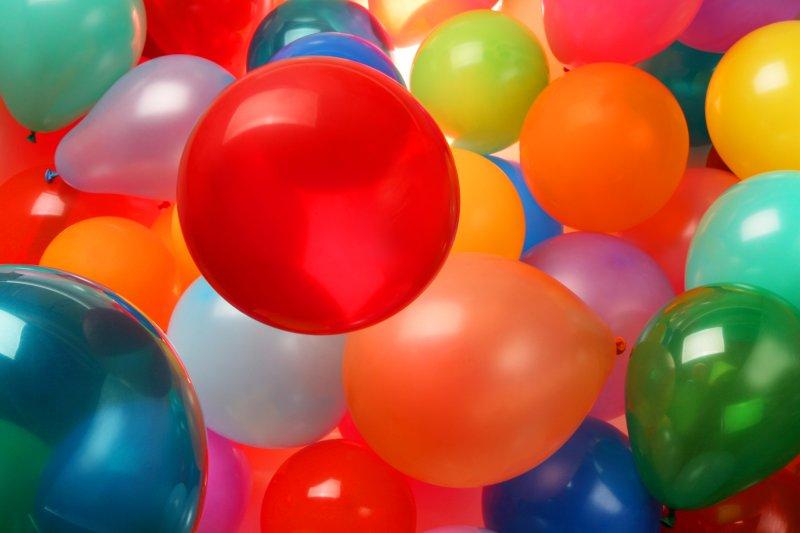
Radioactive radon gas is a decay product of uranium and thorium, which are found naturally in rocks, soil and building materials. Radon is a significant component of background radiation and can accumulate in poorly ventilated indoor environments. In this data set, we investigated the effect of charging a balloon, which was then hung in an enclosed space, on its level of radioactivity. Students will write a hypothesis, graph data, write a conclusion and use provided information to answer questions about radioactivity and radon, experimental design, accuracy, validity and reliability.
Aligning Taipan, one of ANSTO's neutron scattering instruments

Scientists ensure their measurements are accurate and precise by regularly calibrating their instruments. In this data set, students manipulate and graph calibration data from Taipan, one of ANSTO's neutron scattering instruments. Students must determine whether Taipan is functioning within the acceptable limits of error for the scientists' experiments.