
Research highlights
To view data on fine particle pollution from key sites along with the New South Wales (Australia) coast, please see below.
Monthly average PM2.5 concentrations from 2007-2013 have been used to produce contour maps that provide an indication of fine particle concentration levels from Wollongong through Sydney to Newcastle in NSW, Australia.
A bounding box of 8° x 8° was defined with Sydney (located at 151.2086°E, 33.8683°S) being in the centre of the box. Kriging (a Gaussian process regression method) was then used to carry out a spatial interpolation.
Given that data from only seven ASP sampling sites were available for the interpolation; and effectively an extrapolation was being obtained further form these monitoring locations, the values at the boundary of the box were set to the median values of the data-set divided by 5 and data further than 100km from any ASP site should be treated with caution.
The boundary was chosen such that it had small impact on interpolated values close to the locations where measurements were available.
Upper Hunter particle characterisation study
The Upper Hunter Fine Particle Characterisation Study commenced in January 2012 to study the composition of fine particles 2.5 microns and smaller in diameter (PM2.5) in the Upper Hunter Valley towns of Singleton and Muswellbrook.
More details, the final report and a summary of the findings can be found here:http://www.environment.nsw.gov.au/aqms/uhaqmnfpcs.htm
The project was jointly funded by the NSW Office of Environment and Heritage and NSW Health, with co-investment from the Commonwealth Scientific and Industrial Research Organisation (CSIRO) as the lead researcher. OEH staff conducted the sampling at each location. Researchers from CSIRO and the Australian Nuclear Science and Technology Organisation (ANSTO) led sample analysis, evaluation and the reporting of results.
Lower Hunter particle characterisation study
This study is a collaborative project commissioned and funded by the New South Wales (NSW) Environment Protection Authority (EPA). The collaborating organisations consist of: the NSW Office of Environment and Heritage (OEH), NSW Health, the Commonwealth Scientific and Industrial Research Organisation (CSIRO) and the Australian Nuclear Science and Technology Organisation (ANSTO).
The 12 month (March 2014 to February 2015) study is being undertaken to provide communities in the Lower Hunter with scientific information about the composition and likely sources of airborne particles 2.5 micrometres and smaller in diameter (PM2.5) in the Lower Hunter region, and the composition of particles 10 micrometres and smaller in diameter (PM10) in the vicinity of the Newcastle Port. Study findings will be released early in 2016.
More details about the study can be found here: http://www.environment.nsw.gov.au/aqms/lowhunterparticle.htm
Air Pollution Study in Papua New Guinea
We currently have 3 ASP sampling units operating in the highlands of PNG as part of an ongoing ANSTO airborne fine particle study funded by the Porgera Joint Venture (PJV) to assess the local PM2.5around their large Porgera gold mine. More details
Ongoing ASP involvement in the Asia region through the UN-International Atomic Energy Agency (IAEA)
Visible atmospheric haze is a major problem for many countries in the Asia region. Identifying the contributing sources of this haze is the first critical step toward developing strategies for reducing or eliminating this pollution.
ANSTO is part of an ongoing Regional Co-operative Agreement (RCA) project studying both fine and coarse air particles in 14 countries including Australia, Bangladesh, China, India, Indonesia, Korea, Malaysia, Mongolia, New Zealand, Pakistan, Philippines, Sri Lanka, Thailand and Vietnam.
Already the information collected, called the Asia-Pacific Aerosol Database (A-PAD), is proving to be an invaluable resource for developing new air pollution models and pollution reduction strategies based on better quantification of local source contributors, as well as the influence of sources like long-range transport on the particle concentrations at a site.
Air pollution monitoring in Asia
Fine-particle pollution in Asia is generally very high compared with internationally accepted health goals. Much of this fine-particle pollution is produced by motor vehicles, fossil-fuel combustion, industrial processes and even windblown soils from desert regions.
As part of a long-term project in the Asian region, ANSTO has been using nuclear techniques not only to characterise fine-particle pollution but also to quantify their sources and origins across 15 countries in the region.
In 2002, the International Atomic Energy Agency (IAEA) established a Regional Co-operative Agreement (RCA) with 14 member countries, including Australia, Bangladesh, China, India, Indonesia, Korea, Malaysia, Mongolia, New Zealand, Pakistan, Sri Lanka, Thailand and Vietnam, to monitor, characterise and quantify sources of fine-particle pollution in each of these countries.
This is a unique study as each country uses the same stacked filter systems and has sampled them at the same time twice a week for at least 10 years.
Relevance of study
The data obtained are unique for the region and will be used to correlate medical conditions related to lung disease and heart conditions with high pollution days, with sources of air pollution and with hospital admissions.
Even for relatively pollution-free countries like Australia estimates show that generally more people are dying each year from air-pollution related issues than are killed on the roads.
In these Asian regions the air-pollution levels are much higher, and hence the health effects are much more significant.
Studying these particles, their sources and their origins will help regulators better tackle air-pollution issues in their respective countries.
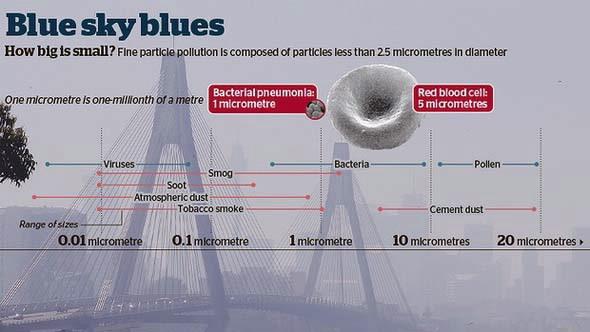
What are fine particles?
Fine particles in ambient air are defined as those particles with aerodynamic diameters less than 2.5 µm (approximately 10 times smaller than the width of a human hair). Particles in this size range can be directly absorbed into the bloodstream from the lungs, are most efficient at absorbing and scattering visible light and can travel thousands of kilometres from their original source emission points.
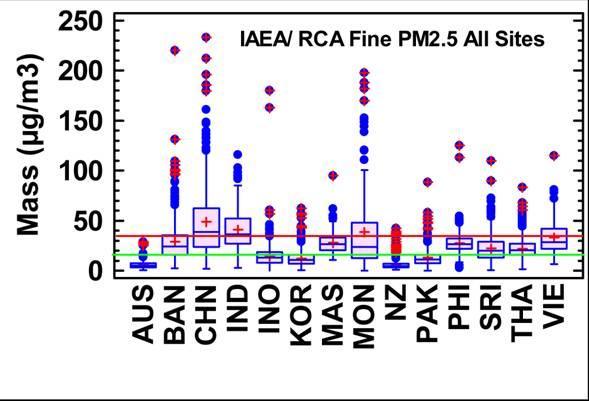
Figure 1. The distribution of fine particle air pollution for each of the member countries between 2002-2008. In this box and whisker plot, the hatched boxes contain 25%-75% of the measurements for each country, the vertical whiskers from each box cover the 95% confidence interval, the (+) signs are the means and the horizontal bars the median values. The remaining points outside the box and whiskers represent extreme values.
The red horizontal bar at 35 µg/m³ is the current US EPA 24 hour maximum fine particle goal and the green horizontal bar at 15 µg/m³ is an annual average goal.
Clearly, most Asian countries exceed both US EPA goals for fine particles much of the time.
ANSTO’s contribution to this international research effort
ANSTO has analysed each of its exposed filters using four IBA nuclear techniques 1) particle-induced X-ray emission (PIXE), particle-induced gamma-ray emission (PIGE), particle elastic nuclear scattering analysis (PESA) and Rutherford backscattering (RBS).
These techniques have the sensitivity to identify and measure between 20-30 different chemical species from aluminium to lead at concentrations as low as 1000,000,000th of a gram in a cubic metre of air (ng/m³) that has passed through the filter.
Not just elements but sources
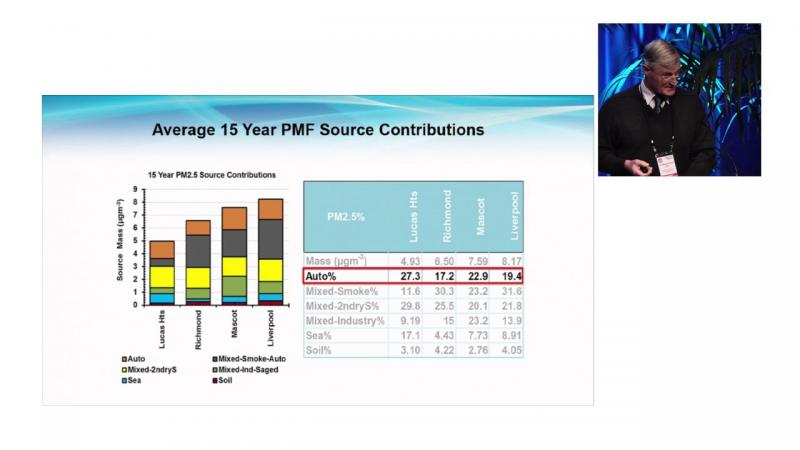
ANSTO also uses a multi-dimensional statistical method known as Positive Matrix Factorisation (PMF) to determine the inter-elemental correlation between all of the 20-30 measured elements.
This complex method mathematically identifies key elemental fingerprints, known as factors, which are associated with generic fine-particle pollution sources such as soil, cars, industry and smoke.
Long-distance transport of fine particles from sources
By combining available wind back trajectory information with the Positive Matrix Factorisation (PMF) analysis, we can determine the likely origins of major pollution sources for a particular site.
For example, it is well known that the Taklamakan and Gobi desert regions produce large dust storms between March and April each year which may travel across Korea and Japan.
Figure 2 below combines the soil fingerprint obtained from PMF with wind back trajectory data. The squares represent the various dessert regions close to the sampling site in Hanoi.
The symbols in the boxes represent the number of wind trajectory intersections that impacted Hanoi between April 2001 and December 2008 with Soil source levels above 6 µg/m³. A similar example for coal source levels above 30 µg/m³ impacting Hanoi over the same time period is shown infigure 3.
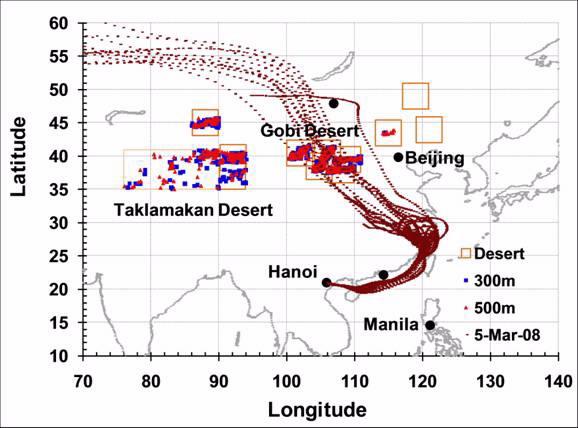
Figure 2: Back trajectory plots and intersections for extreme Soil events between 2001-2008. The symbols within the desert regions (boxes) represent the number of trajectory intersections that impacted the Hanoi site between April 2001 and December 2008 with Soil levels above 6 µg/m³.
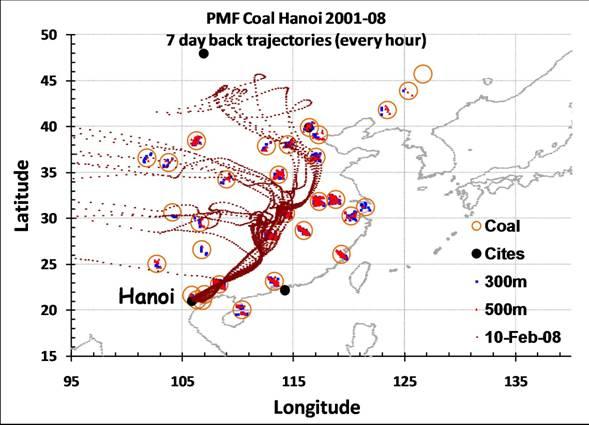
Figure 3: Back trajectory plots and intersections for extreme Coal events between 2001-2008. The symbols within the coal-fired power stations (open circles) represent the number of trajectory intersections that impacted the Hanoi site between April 2001 and December 2008 with Coal levels above 30 µg/m³.
Clearly, the Gobi and Taklamakan deserts impact the Hanoi site as do several major coal-fired power stations in eastern China. These source sites represent long-range transport of fine-particle pollution some hundreds and even thousands of kilometres into Hanoi.
A subset of the database related to this project has now been released online and can be downloaded at: http://www.rcaro.org/others/articles/view/tableid/pubothers/id/2078
Publications
The Aerosol Sampling Program (ASP) has been running for almost 20 years. Aerosol samples are routinely collected in a number of Australian sites as well as within Asia. Samples are analysed by means of IBA techniques and results are interpreted and reported. This page contains links and downloads to a range of ASP related publications.
ASP Databases
APAD and ASFID: Airborne Particulate Matter Databases Related to the Asia-Pacific Region
The presence of atmospheric particulate matter pollution, often generically referred to as haze or smog, is a significant issue that impacts every urbanised city, country or region in the world to varying degrees. It can greatly reduce visibility on a local and regional scale, can be easily transported over long distances across international borders and can influence climate change on a global scale through absorption and scattering of light.
There is a growing body of evidence strongly linking the inhalation of fine air pollution to a range of serious human health implications including respiratory disease and infection, cardiovascular disease, stroke and premature death. A 2014 report from the World Health Organisation (WHO) estimates that approximately 7 million people in 2012 died prematurely as a result of exposure to air pollution– making it one of the world’s largest single environmental health risks.
This is particularly concerning for a number of countries in the Asia-Pacific region that, as a result of rapid urban development, have significantly higher levels of air particulate pollution when compared with internationally accepted goals. Research aimed at identifying the composition and source contributions of this pollution is the first critical step needed to develop effective strategies for reducing it which has the potential to save millions of lives.
The International Atomic Energy Agency (IAEA) under the auspices of the United Nations initiated a Regional Cooperative Agreement (RCA) project more than 15 years ago to collect, quantify and use nuclear-based analytical techniques to characterise airborne particulate matter across the greater Asia-Pacific region.
The fifteen IAEA member states that collaborated in this long-running project include (In alphabetical order): Australia, Bangladesh, China, India, Indonesia, Korea, Malaysia, Mongolia, Myanmar, New Zealand, Pakistan, Philippines, Sri Lanka, Thailand and Vietnam.
The project has generated the following two air pollution databases containing one of the longer-term and most comprehensive air particulate matter datasets for the Asia-Pacific region to date. We believe these databases will be a valuable resource which can be utilised for improved air pollution models and pollution reduction strategies.
Asia-Pacific Aerosol Database (APAD)
This database contains the measured concentrations (ng/m³), errors and minimum detectable limits of between 15 - 40 different elemental species for each sampled day and site. The database is provided in EXCEL workbook (.xlsx) format to facilitate its access and usability. Detailed information regarding the database contents, format, sampling and analysis methodology is provided in the accompanying user manual.
Downloads: User Manual (pdf) | Database (.xlsx) 25.9MB
If you use this database, please include the following citation: David D. Cohen, Armand J. Atanacio. The IAEA/RCA Fine and Coarse Particle Ambient Air Database. ANSTO report/E-784, 2015. ISBN: 1921268247
Asia-Pacific Source Fingerprint Database (ASFID)
This database contains an attempt by the national project coordinator (NPC) of each participating country in the IAEA/ RCA program to perform receptor source fingerprinting on the APAD dataset for one of their sites using Positive Matrix Factorisation (PMF). The database is provided in an EXCEL VBA macro workbook (.xlsm) which can be used to both view and export the PMF plots and data. Detailed information regarding the applied PMF technique, the database contents, format and instructions on its use is provided in the accompanying user manual. Downloads: User Manual (pdf) | Coarse Database files (.zip) | Fine Database files (.zip)
If you use this database, please include the following citation: Armand J. Atanacio, David D. Cohen. The IAEA/RCA Fine and Coarse PMF Receptor Fingerprint Database. ANSTO report/E-783, 2016. ISBN: 1921268247
ASP Related Media
2017 Clean Air Summit
Air pollution chasers: Nuclear techniques to track air pollution
ANSTO is using novel and evolving nuclear techniques to identify the underlying contributors to fine particle air pollution.
Check out some of our live data monitoring feeds from key sites along the New South Wales(Australia) coast.
While Australia’s air quality is generally excellent, the techniques can identify pollution sources so it can be further improved, and have significant applications in developing or industrialising countries.
Using nuclear instruments such as positive ion accelerators and data collection, scientists can now determine elemental air pollution fingerprints, quantifying sources and origin with great accuracy.
This method is, right now, being used in Australia and overseas to identify impacts of fine particle pollution on health, visibility and long range transport of pollutants.
In Asia it has been used to track the fingerprints of factories that contribute to air quality issues, and even in Australia, it has been used for many years to identify fine particle pollution sources.
Professor David Cohen, Chief Research Scientist, Institute for Environmental Research at ANSTO, explains the purpose of the fingerprinting is not finger-pointing, but to help improve air quality.
“Even for relatively low-pollution countries such as Australia, atmospheric fine particle pollution can impact on human health, which is why we measure and track sources,” said Professor Cohen.
“If you can identify sources of pollution as well as quantify their contributions to the total pollution load, you can better understand how to reduce the impact of said pollutants, and that’s an important milestone for science.
“There has been strong progress over the last decade to identify sources and tackle polluters, and our research is about enabling practical, tangible steps towards assisting air pollution managers to continue to improve air quality.
“By world standards, we have good air quality in Sydney which has been consistently improving over many years, and research like this will help us to further enhance it.”
Over the past decade, studies of fine particle pollution have moved from just chemical characterisation to using statistical techniques and models to fingerprint the source of pollution.
Coal-fired power stations are known emitters of fine particles and pollutant gases, and ANSTO techniques have determined contributions of eight coal-fired power stations in NSW to the total pollution load in the greater Sydney metropolitan area where over four million people live and work.
The data obtained through use of these nuclear techniques can also be used to correlate high pollution days, with sources of air pollution.
Professor Cohen’s latest peer reviewed research, Accelerators provide fingerprints of coal-fired power stations’ air pollution in metropolitan Sydney, is available here.
The science of monitoring air pollution
Fine particle samples are collected on thin stretched Teflon filters and analysed using Ion Beam Analysis, which is a fast, sensitive and non-destructive way of establishing chemical concentrations within the filter.
The filters are characterised by their weight and elemental composition. More than 20 different elements - including carbon, silicon, iron, sulphur and lead can be identified.
Revealing the sources of Sydney's air pollution
Fine particles in our atmosphere can travel hundreds of kilometres every day. Their monitoring is crucial as they have significant impact on both human health and the environment.

Over the last decade, nuclear techniques for studying fine particles in the atmosphere have improved significantly, moving from simply analysing their chemical composition to combining meteorological data, such as wind patterns and trajectory with statistical modelling, to define where the pollution actually came from.
Consequently, it is now possible to not only determine the source of pollution via a chemical composition ‘fingerprint,’ but to also quantify that source’s total contribution of fine particles in a specific location. In short, we can identify individual polluters and measure how many fine particles originated from those polluters.
David Cohen and his team have collected samples in the Richmond area of western Sydney. By using these combinatory techniques of analysing the particles’ chemical composition and taking account of meteorological data with statistical modelling, they are able to quantify the effects of air pollution.
This demonstration project has found that up to half of the total sulfate air pollution in the greater Sydney region can be attributed to emissions from NSW’s eight coal-fired power stations.
Despite being located many kilometres outside of the greater Sydney metropolitan area, these coal-fired power stations have a significant impact on air quality in the CBD areas of Sydney. This information is used by air quality managers to inform pollution control measures and decision making.
Introduction
As atmospheric fine particle pollution has significant impacts on our lives, there has been significant progress over the last decade to better identify its sources and hold polluters accountable. Increased computing power with new algorithms that handle big data sets has played an important role in advancing these studies.
In order to handle multiple observations in environmental monitoring mathematical models are used to analyse the different types of data sets. For the study of air pollution we investigate fine particles and analyse the data using positive matrix factorisation (PMF) and multi-linear engine (ME) methods [1,2] for determining the number and composition of sources of pollution.
Coal-fired power stations are known emitters of fine particles PM2.5 (PM2.5 stands for particles of a size of 2.5 microns or less, i.e. 0.025 mm) and pollutant gases such as SOX and NOX.
ANSTO researchers have developed techniques to determine the contributions of eight coal-fired power stations, which burn over 25 MT/year (yr) of low grade sulfur coal, to the PM2.5 mass loading in the greater Sydney metropolitan area.
We have applied and compared PMF and ME techniques for identifying the source by its elemental fingerprint and quantifying the contribution of a source to total pollution levels.
Using the ME methods we included data of wind observations and profiles of the trajectory positions. By combining these various parameters, sources external to the Sydney metropolitan region can uniquely be tied to fine particle measurements made within this region.
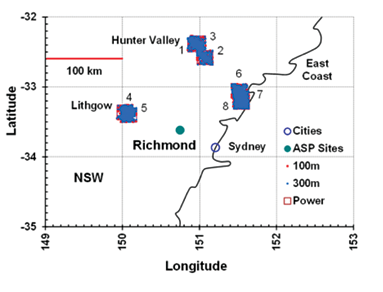
Figure 1A: Locations of eight coal powered power stations supplying Sydney. Boxes labelled 1 to 8 show the locations of the eight NSW coal-fired power stations. The 100m and 300m dots within each of these boxes show the number of wind back trajectories from Richmond site that intersected with each power station. The large symbol (•) shows the location of the Richmond sampling site.
Study Site and Local Conditions
The locations of the eight coal-fired power stations supplying Sydney’s electricity are shown in Fig.1a. The average sulfur content of coal burnt for power generation in NSW at these stations is around 0.5% by weight.
The power station emissions represent 243 kT/year of sulfur dioxide emissions across NSW. In the State of NSW, of the total 290 kT/yr of sulfur dioxide emissions produced each year, over 80% are from the coal-fired power stations.
The power station emissions represent 243 kT/year of sulfur dioxide emissions across NSW. In the State of NSW, of the total 290 kT/yr of sulfur dioxide emissions produced each year, over 80% are from the coal-fired power stations.
The sampling site (Fig.1b) was located at Richmond (-33.618°S, 150.748°E) in an open grassed area in the grounds of the University of Western Sydney, 53 km northwest of the Sydney CBD. Samples were taken every Sunday and Wednesday for 24 hours from midnight to midnight.
The site was influenced by sources from within the Sydney CBD region and sources external to the greater metropolitan area, such as the power stations.
The site was influenced by sources from within the Sydney CBD region and sources external to the greater metropolitan area, such as the power stations.
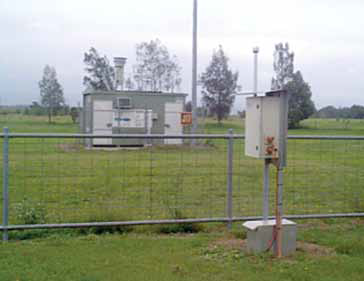
Figure 1B: The ANSTO cyclone sampler (foreground) at the Richmond site of the University of Western Sydney.
Measuring chemical composition
Accelerator-based Ion Beam Analysis (IBA) techniques have been used at ANSTO for many decades to determine chemical composition of fine particulate matter. They are ideally suited to this task as they have the sensitivity to non-destructively measure elements from hydrogen to lead with concentration down to nanograms per cubic metre of air sampled.
The measurements of the elemental contributions use the following techniques: Particle-Induced X-ray Emission (PIXE), Proton-Induced Gamma Emission (PIGE), Rutherford Backscattering (RBS) and Particle- Elastic Scattering (PESA) [3].
These four techniques together with laser absorption methods for black carbon analysis [4] were employed to determine 21 different element species between hydrogen (H) and lead (Pb). During this study, samples were taken every Sunday and Wednesday, providing 912 samples for analysis covering the period 2001-2011.
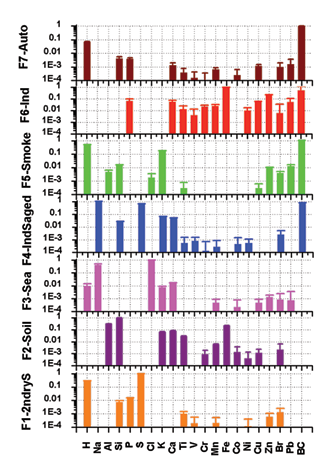
Figure 2: The seven factors or source fingerprints obtained from the standard positive matrix factorisation (PMF) analysis.
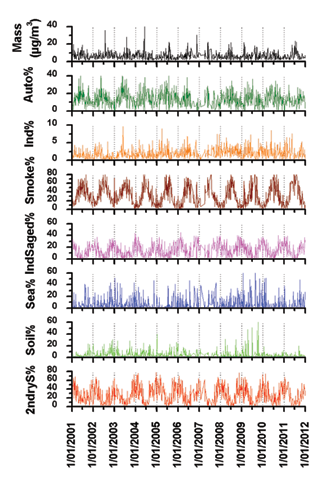
Figure 3: Time series plots for the total PM2.5 mass and the percentage mass contributions of the 7 standard PMF factors or fingerprints.
Positive matrix factorisation fingerprints and source contributions
For a data set of this size, the statistical approach of positive matrix factorisation (PMF) was applied to identify the pollution source by its elemental fingerprints, as well as to quantify the contributions of these sources to the total PM2.5 concentration. Figs. 2 and 3 show the results for analysing the measurements using PMF and Table 1 lists the sulphur contribution for the fingerprints.
We found that seven factors fit the data and we can thus determine the fingerprint of the source, see Fig. 2 and plot their daily contributions in Fig. 3. The total PM2.5 gravimetric mass could be explained to within 2% by these seven fingerprints and each elemental fingerprint was significantly determined at the 99% confidence interval in this PMF model.
The average percentage contributions to the total PM2.5 mass for each of these standard PMF sources during the study period, see Table 1a, shows that the two major sulfur sources, i.e. secondary sulfur (2ndryS) and industrial-aged sulfur (IndSaged), accounted for 40% of the mass followed closely by Smoke from biomass burning with 37%.
Table 1b shows that for the standard PMF analysis 73% of the measured total sulfur was associated with the 2ndryS fingerprint and 27% with the IndSaged fingerprint. The remaining four fingerprints account for 23% of the fine mass, but were not really the focus of the current study as they were generally associated with diffuse or distributed sources and not associated with the eight coal-fired power stations point sources which we want to quantify here.
Fig. 3 shows the daily variations of these seven sources over the 11 year study period. Seasonal (summer-winter) variations are clearly obvious. For example, the winter smoke is 60%- 80% of the fine mass while the summer smoke is generally less than 10%. This is due mainly to domestic wood fires used for heating in the winter in many Sydney homes.
This seven factor standard PMF analysis produced two sulfur containing fingerprints, 2ndryS and IndSaged both of which were a mixture of several possible sources. However, it does not provide a power station fingerprint or a breakdown of how much of 2ndryS or IndSaged sources were power station related. To achieve this we need to apply the more sophisticated ME analysis to our dataset.
% Fingerprint masses for different scenarios | ||
| Fingerprint | Standard PMF 7 Factors | ME 9 Factors |
| Secondary sulfur - 2ndryS (total) | 27.3±0.6 | 25.3±0.8 |
2ndrySPower | 12.7±0.4 | |
| 2ndrySnoPower | 12.6±0.4 | |
| Industrial aged sulfur - IndSaged (total) | 12.4±0.8 | 14.3±0.7 |
| IndSagedPower | 5.60±0.3 | |
| IndSagednoPower | 8.70±0.4 | |
| Soil | 4.76±0.4 | 4.90 |
| Sea | 5.54±0.4 | 5.40 |
| Smoke | 37.1±0.7 | 33.8 |
| Industry | 1.75±0.7 | 1.50 |
| Auto | 11.2±0.8 | 14.8 |
| Total% | 100±5 | 100±5 |
Table 1 (a): Percentage contributions to the total PM2.5 mass for each of the fingerprints in the standard PMF analyses and for the ME analyses described below.
Combining wind back trajectories and statistical analysis
Here, we use the multi-linear engine (ME) approach to split the two sulphur fingerprints 2ndryS and IndSaged obtained in the standard PMF analysis into two components each. The first component are contributions of wind back trajectories from Richmond [4,5] which passed over at least one of the eight identified power stations (Power) and the second component are contributions that did not pass over any power stations (noPower).
Consequently, the seven standard PMF fingerprints of Fig. 2 are turned into nine fingerprints which were then analysed by ME techniques. These new methods have been fully discussed in reference [7].
This ME analysis produced not only nine source fingerprints and their contributions, but also a range of power and non-power sulfur source fingerprint masses contributing to the total PM2.5 mass loadings at the Richmond site. This is a unique aspect of this approach as this enabled us to define Power fingerprints and to put limits on the possible contributions these fingerprints – and consequently the power stations – made to the measured fine (PM2.5) mass at the Richmond receptor site. These contributions are summarised by the ME data in the right-hand columns of Table 1.
Sulfur contributions (%) | ||
| Standard PMF | ME | |
| Fingerprint | 7 Factors | 9 Factors |
| 2ndryS (total) | 72.9±4 | 74.8±4 |
| 2ndrySPower | 36.5±2 | |
| 2ndrySnoPower | 38.3±2 | |
| IndSaged (total) | 27.1±2 | 25.2±2 |
| IndSagedPower | 10.6±0.8 | |
| IndSagednoPower | 14.6±1 |
Table 1 (b): Percentage contributions to the total measured sulfur content in the fine PM2.5 fraction for each of the fingerprints in the standard PMF analyses and for the ME analyses described below.
Associating the fine particle samples to their origins
Using PMF techniques we could identify and quantify seven different fingerprints of sources of fine particles collected at the outskirts of Sydney. Two of these fingerprints, secondary sulfate and aged-industrial sulphur were each split in two and, through wind back trajectories, sorted into two groups: - those passing over coal-fired power stations and those not.
ME techniques together with wind back trajectory data from [6] were then applied to define fingerprints associated with coal-fired power stations as well as quantifying their contributions to total PM2.5 mass loadings.
There are eight coal-fired power stations in NSW burning 25 MT/ yr of coal and emitting 243 kT/yr of SO2 which is converted by water and sunlight to sulfate particles. These power stations were many kilometres outside the greater Sydney metropolitan area, but still had a significant impact on the fine particle mass loadings measured at the sampling site within the metropolitan area. The PM2.5 eleven year average mass at the Richmond sampling site was 6.48 μg/m3. The corresponding ammonium sulfate estimate was 1.65 μg/m3 or 26% of the PM2.5 mass.
The two PMF fingerprints, secondary sulfate (2ndryS) and aged industrial sulfur (IndSaged) accounted for 27% and 12% respectively, making a total of 39% of the PM2.5 mass. Using wind back trajectories we could distinguish these two fingerprints into power and non-power contributions. By subsequently running an ME analysis over them, we were able to produce coal-fired power station fingerprints.
These power related fingerprints were responsible for approximately 18% of the total PM2.5 mass and 47% of the total sulfate measured at the sampling site. On average, up to a half of the total sulfate measured in the greater Sydney region can be attributed to coal-fired power station emissions.
References
- Paatero, P., Tapper, U., 1994. Positive Matrix Factorisation: A non-negative factor model with optimal utilisation of error estimates of data values, Environmetrics, Vol 5, 111-126.
- Cohen, D.D., Crawford, J., Stelcer, E., Bac, V.T., 2010. Characterisation and source apportionment of fine particulate sources at Hanoi from 2001 to 2008. Atmospheric Environment 44, 320-328.
- Cohen, D.D., 1998. Characterisation of atmospheric fine particles using IBA techniques. Nuclear Instruments and Methods in Physics Research Section B: Beam Interactions with Materials and Atoms 136, 14-22.
- Taha, G., Box, G.P., Cohen, D.D., Stelcer, E., 2007. Black carbon measurement using laser integrating plate method. Aerosol Science and Technology 41, 266-276.
- Draxler R.R., 1991. The accuracy of trajectories during ANATEX calculated using dynamic model analysis versus rawinsonde observations. Journal of Applied Meteorology 30, 1466-1467.
- Draxler R.R., Rolph G.D., 2003. Hybrid Single-Particle Lagrangian Integrated Trajectory (HYSPLIT), model. http://www.arl.noaa.gov/ready/hysplit4.html.
- Cohen, D. D., Crawford J., Stelcer E., Atanacio A., 2012. A new approach to the combination of IBA techniques and wind back trajectory data to determine source contributions to long range transport of fine particle air pollution. Nucl. Instru. Methods in Physics Research B273, 186-188.
ASP Newsletters
Aerosol Sampling Program (ASP) Newsletters are published regularly to keep interested parties up to date with recent analyses and results. Each newsletter focuses on specific data from selected sites around Australia. Some recent Newsletters can be viewed/downloaded as PDF files by following the links below. To receive your own copy of the ASP Newsletter contact Dr David Cohen.
- Newsletter 47 - Aug 2017
- Newsletter 46 - Sep 2016
- Newsletter 45 - Jul 2015
- Newsletter 44 - Jul 2014
- Newsletter 43 - Aug 2013
- Newsletter 42 - Jul 2012
- Newsletter 41 - Jul 2011
- Newsletter 40 - Jul 2010
- Newsletter 39 - Jul 2009
- Newsletter 38 - Jul 2008
- Newsletter 37 - Jul 2007
- Newsletter 36 - Jan 2007
- Newsletter 35 - Jul 2006
- Newsletter 34 - Jan 2006
- Newsletter 33 - Jul 2005
- Newsletter 32 - Jan 2005
- Newsletter 31- Jul 2004
Earlier issues of the newsletter are available upon request.
Environmental Studies
Upper Hunter Valley Particle Characterization Study report (2013)
Ion Beam Analysis, Positive Matrix Facotrisation and Wind Back Trajectories, Tools for PM2.5 Fine Particle Research in Australia. 20th Int. Clean Air Conf, Auckland NZ, 31st Jul - 2nd Aug 2011
Quantifying Respirable Crystalline Silica in the Ambient Air of the Hunter Valley, NSW - Sorting the Silica from the Silicon. 20th Int. Clean Air Conf, Auckland NZ, 31st Jul - 2nd Aug 2011
Using multiple type composition data and wind data in PMF analysis to apportion and locate sources of air pollutants. Atmoshpheric Environment 45 (2011) 439 - 449
A new method to combine IBA of fine aerosols with Radon-222 to determine source characteristics. Nuclear Instruments and Methods in Physics Research B 269 (2011) 2041-2051
Long-range transport of soil dust and smoke pollution in the South Asian region. Atmospheric Pollution Research 2 (2011) 151-157
Fine particle characterisation, source apportionment and long-range dust transport into the Sydney Basin: a long term study between 1998 and 2009. Atmospheric Pollution Research 2 (2011) 182-189
Application of receptor modelling methods. Atmospheric Pollution Research 2 (2011) 122-125
Characterisation and source apportionment of fine particulate source at Hanoi from 2001 to 2008., Atmospheric Environment 44 (2010) 320-328
Fingerprinting and source apportionment of fine particle pollution in Manila by IBA and PMF techniques: A 7-year study., X-ray Spectrometry 38 (2009) 18-25
A new metric space incorporating radon-222 for generation of back trajectory clusters in atmospheric pollution studies., Atmospheric Environment 43 (2009) 371-381
IBA Methods for Characterisation of Fine Particulate Atmospheric Pollution: A local, regional and global research problem. , Nucl. Instr. and Methods B219-220 (2004) 145-152
Multi-elemental Analysis and Characterisation of Fine Aerosols at Several Key ACE-Asia Sites. , Journal of Geophysical Research, 109 (2004) D19S12, doi:10.1029/2003JD003569